ClimateEngine.org allows researchers and natural resource managers to easily analyze and visualize complex satellite and climate data, helping users understand change in Earth’s landscapes over time
“If you’re trying to study how climate and natural resource management affects the environment, nothing beats the combination of maps and time series for unpacking the data,” says Justin Huntington, Ph.D., Climate Engine project lead and research professor of hydrology at DRI.
First launched in 2016 at the White House Water Summit, ClimateEngine.org is being re-launched with new datasets, support resources, and functionality to increase the capabilities and user-friendliness of the site. Interactive maps and data visualizations produced using decades of satellite data have been a cornerstone of the ClimateEngine.org app, and the new updates will make it easier than ever to use satellite, climate, and forecast data together. These enhanced resources will help Climate Engine’s diverse user community— which includes 12,000+ registered users from public agencies, non-profits, research institutions, and tribal governments — to better use the app to produce charts and maps of environmental indicators such as drought, fire risk, vegetation condition, and agricultural water use.

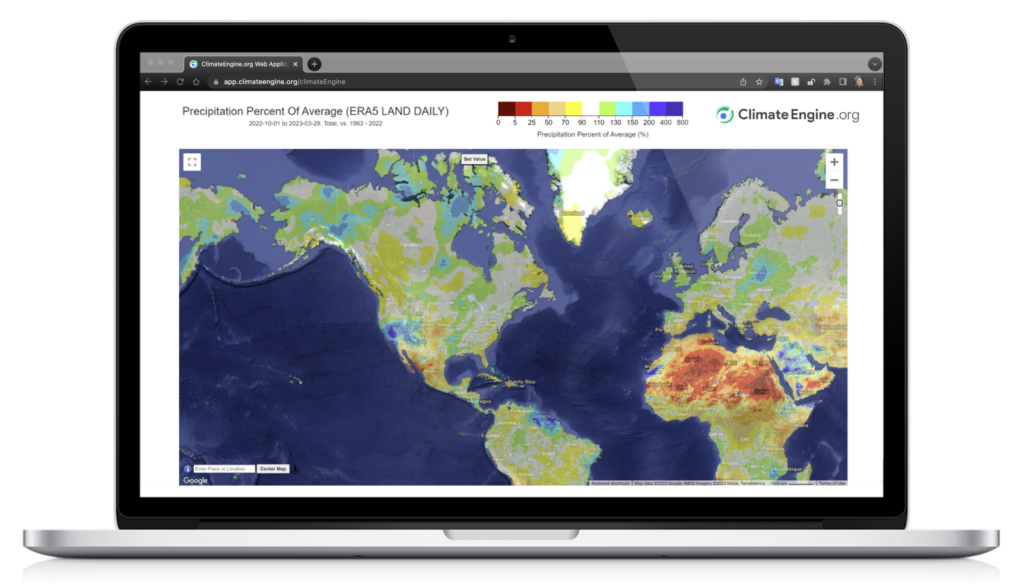
Above: The Climate Engine web application provides on-demand mapping and plotting of hundreds of climate and satellite variables, enabling real-time analysis and monitoring of vegetation, drought, snowpack, and other important environmental conditions.
“As researchers trying to process and visualize many Earth observations together, we understand how difficult it can be to work with these large and disjointed datasets,” Huntington says. “So, we wanted to create a tool that would allow researchers and practitioners to spend more time making discoveries and impact using the best available science.”
The Climate Engine app is unique in that it enables users to visualize and analyze vast amounts of data without the need to code, and results can be downloaded, shared, and recreated with a simple link. It overcomes the computational barriers many research institutions and public agencies face when using large datasets by using Google Earth Engine’s parallel cloud computing platform.
Notable datasets recently added include: 1) ERA5 Ag, which enables calculation of global drought, snowpack, and water demand indicators in near real-time; 2) Rangeland Analysis Platform, a 37-year Landsat dataset of vegetation cover and biomass production for the continental U.S.; and 3) OpenET monthly evapotranspiration, which provides Landsat satellite maps of vegetation water use at field-scale across the Western U.S.
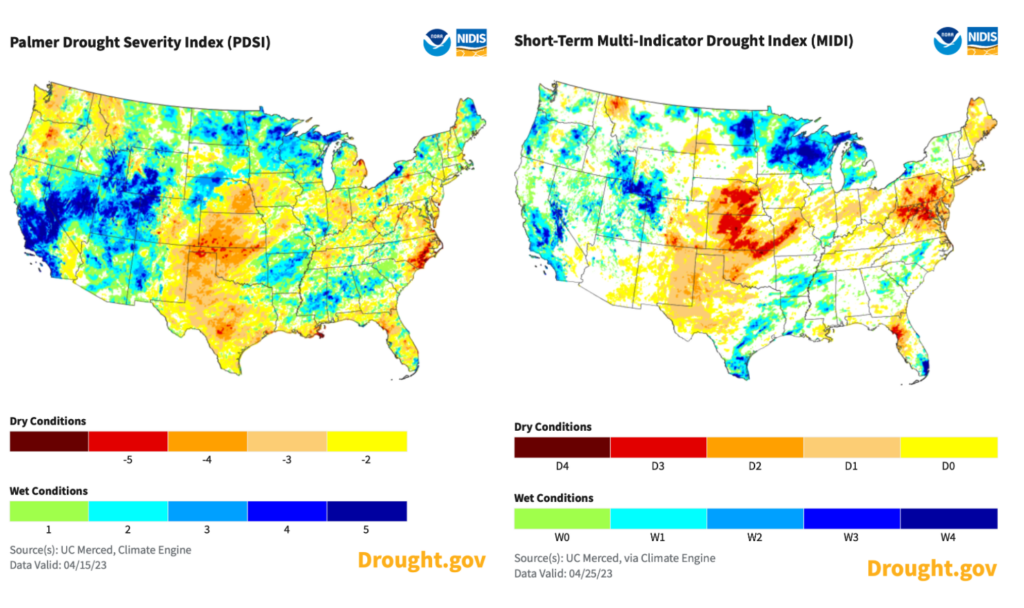
As one of Climate Engine’s primary partners, NOAA’s National Integrated Drought Information System (NIDIS) uses the Climate Engine Application Programming Interface (API) to automatically create drought datasets shared on Drought.gov.
“Climate Engine is a powerful cloud solution that has enabled NOAA to rapidly create and disseminate critical climate and drought information in ways that were previously impossible,” says Steve Ansari, physical scientist with NOAA’s National Centers for Environmental Information. “The initial Faculty Research Award by Google, followed by funding from NOAA-NIDIS and other federal agencies, has led to a very fruitful and rewarding public-private partnership.” This partnership will continue to produce new datasets, processing capabilities, stakeholder engagement, and web application and API enhancements to advance research, drought monitoring, and early warning.

Above: The Climate Engine API is used by NOAA’s National Integrated Drought Information System to automatically update real-time drought maps featured on Drought.gov.
The Bureau of Land Management (BLM) was also an early supporter of ClimateEngine.org due to the agency’s need to adopt a more data-driven approach to monitoring drought and informing grazing decisions. BLM has positioned itself as a leader in monitoring of federal lands through its investment in ground and satellite-based vegetation monitoring. Among other contributions, the agency supported the development of field–scale trends of drought and vegetation conditions within the Climate Engine web application. BLM is continuing to support trainings and integration of the newest datasets into Climate Engine to provide resource managers with the latest information and science on drought and vegetation conditions.

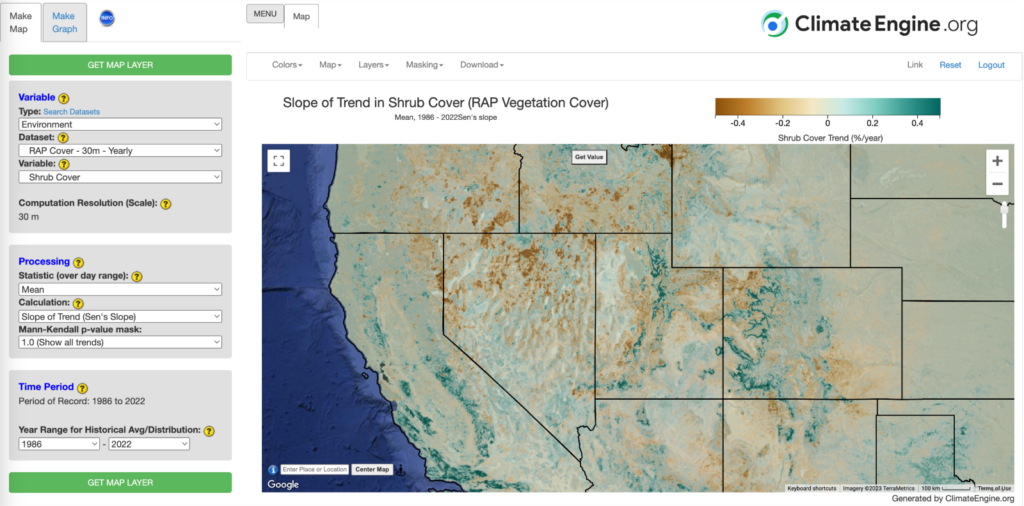
Above: Many advanced calculations are available within the Climate Engine web application, such as per-pixel trends and confidence levels that can be applied to all datasets, including Rangeland Analysis Platform vegetation cover and production data, to assess change over time.
Moving forward this summer, the ClimateEngine.org team will be adding even more features and functionality to the app, further expanding access to the API, and hosting several public agency webinars and in-person workshops across the Western U.S.
ClimateEngine.org is a collaboration between DRI, UC Merced, Google, and federal partners. The science team includes: DRI researchers Justin Huntington, Britta Daudert, Jody Hansen, Thomas Ott, Kristen O’Shea, Charles Morton, Dan McEvoy, and Eric Jensen, as well as UC Merced researchers Katherine Hegewisch and John Abatzaglou. Find out more about the initiative, partnerships, and updates at ClimateEngine.org and Twitter @ClimateEngOrg, and see the initiative’s peer-reviewed publication.
###
About DRI
The Desert Research Institute (DRI) is a recognized world leader in basic and applied environmental research. Committed to scientific excellence and integrity, DRI faculty, students who work alongside them, and staff have developed scientific knowledge and innovative technologies in research projects around the globe. Since 1959, DRI’s research has advanced scientific knowledge on topics ranging from humans’ impact on the environment to the environment’s impact on humans. DRI’s impactful science and inspiring solutions support Nevada’s diverse economy, provide science-based educational opportunities, and inform policymakers, business leaders, and community members. With campuses in Las Vegas and Reno, DRI serves as the non-profit research arm of the Nevada System of Higher Education. For more information, please visit www.dri.edu.


