This study team utilized ice cores to reconstruct past melting rates from the present day back to the 1600s, producing the first continuous, multi-century record of surface melt intensity and runoff from the Greenland ice sheet. Previous studies have utilized satellite observations, which only go back to 1978.
McConnell, who is a research professor of hydrology and head of the Ultra-Trace Ice Core Analytical Laboratory at DRI, first became involved in the study in 2003 when his research group drilled and analyzed the contents of a 150-meter (492-foot) ice core from west-central Greenland. This ice core, known as “D5”, was then used by Sarah Das, Ph.D. from Woods Hole Oceanographic Institution (WHOI) to develop the record of surface melting rates used in this study.
In a subsequent 2016 collaboration with WHOI researchers, McConnell’s group also used DRI’s unique continuous ice-core analytical system to analyze a 115-meter (377-foot) ice core known as “NU”, which was collected in 2015 by the study’s lead author Luke Trusel and colleagues. The detailed DRI measurements of more than 20 elements and chemical species in both the D5 and NU ice cores enabled precise dating of the records that underpin the new findings.

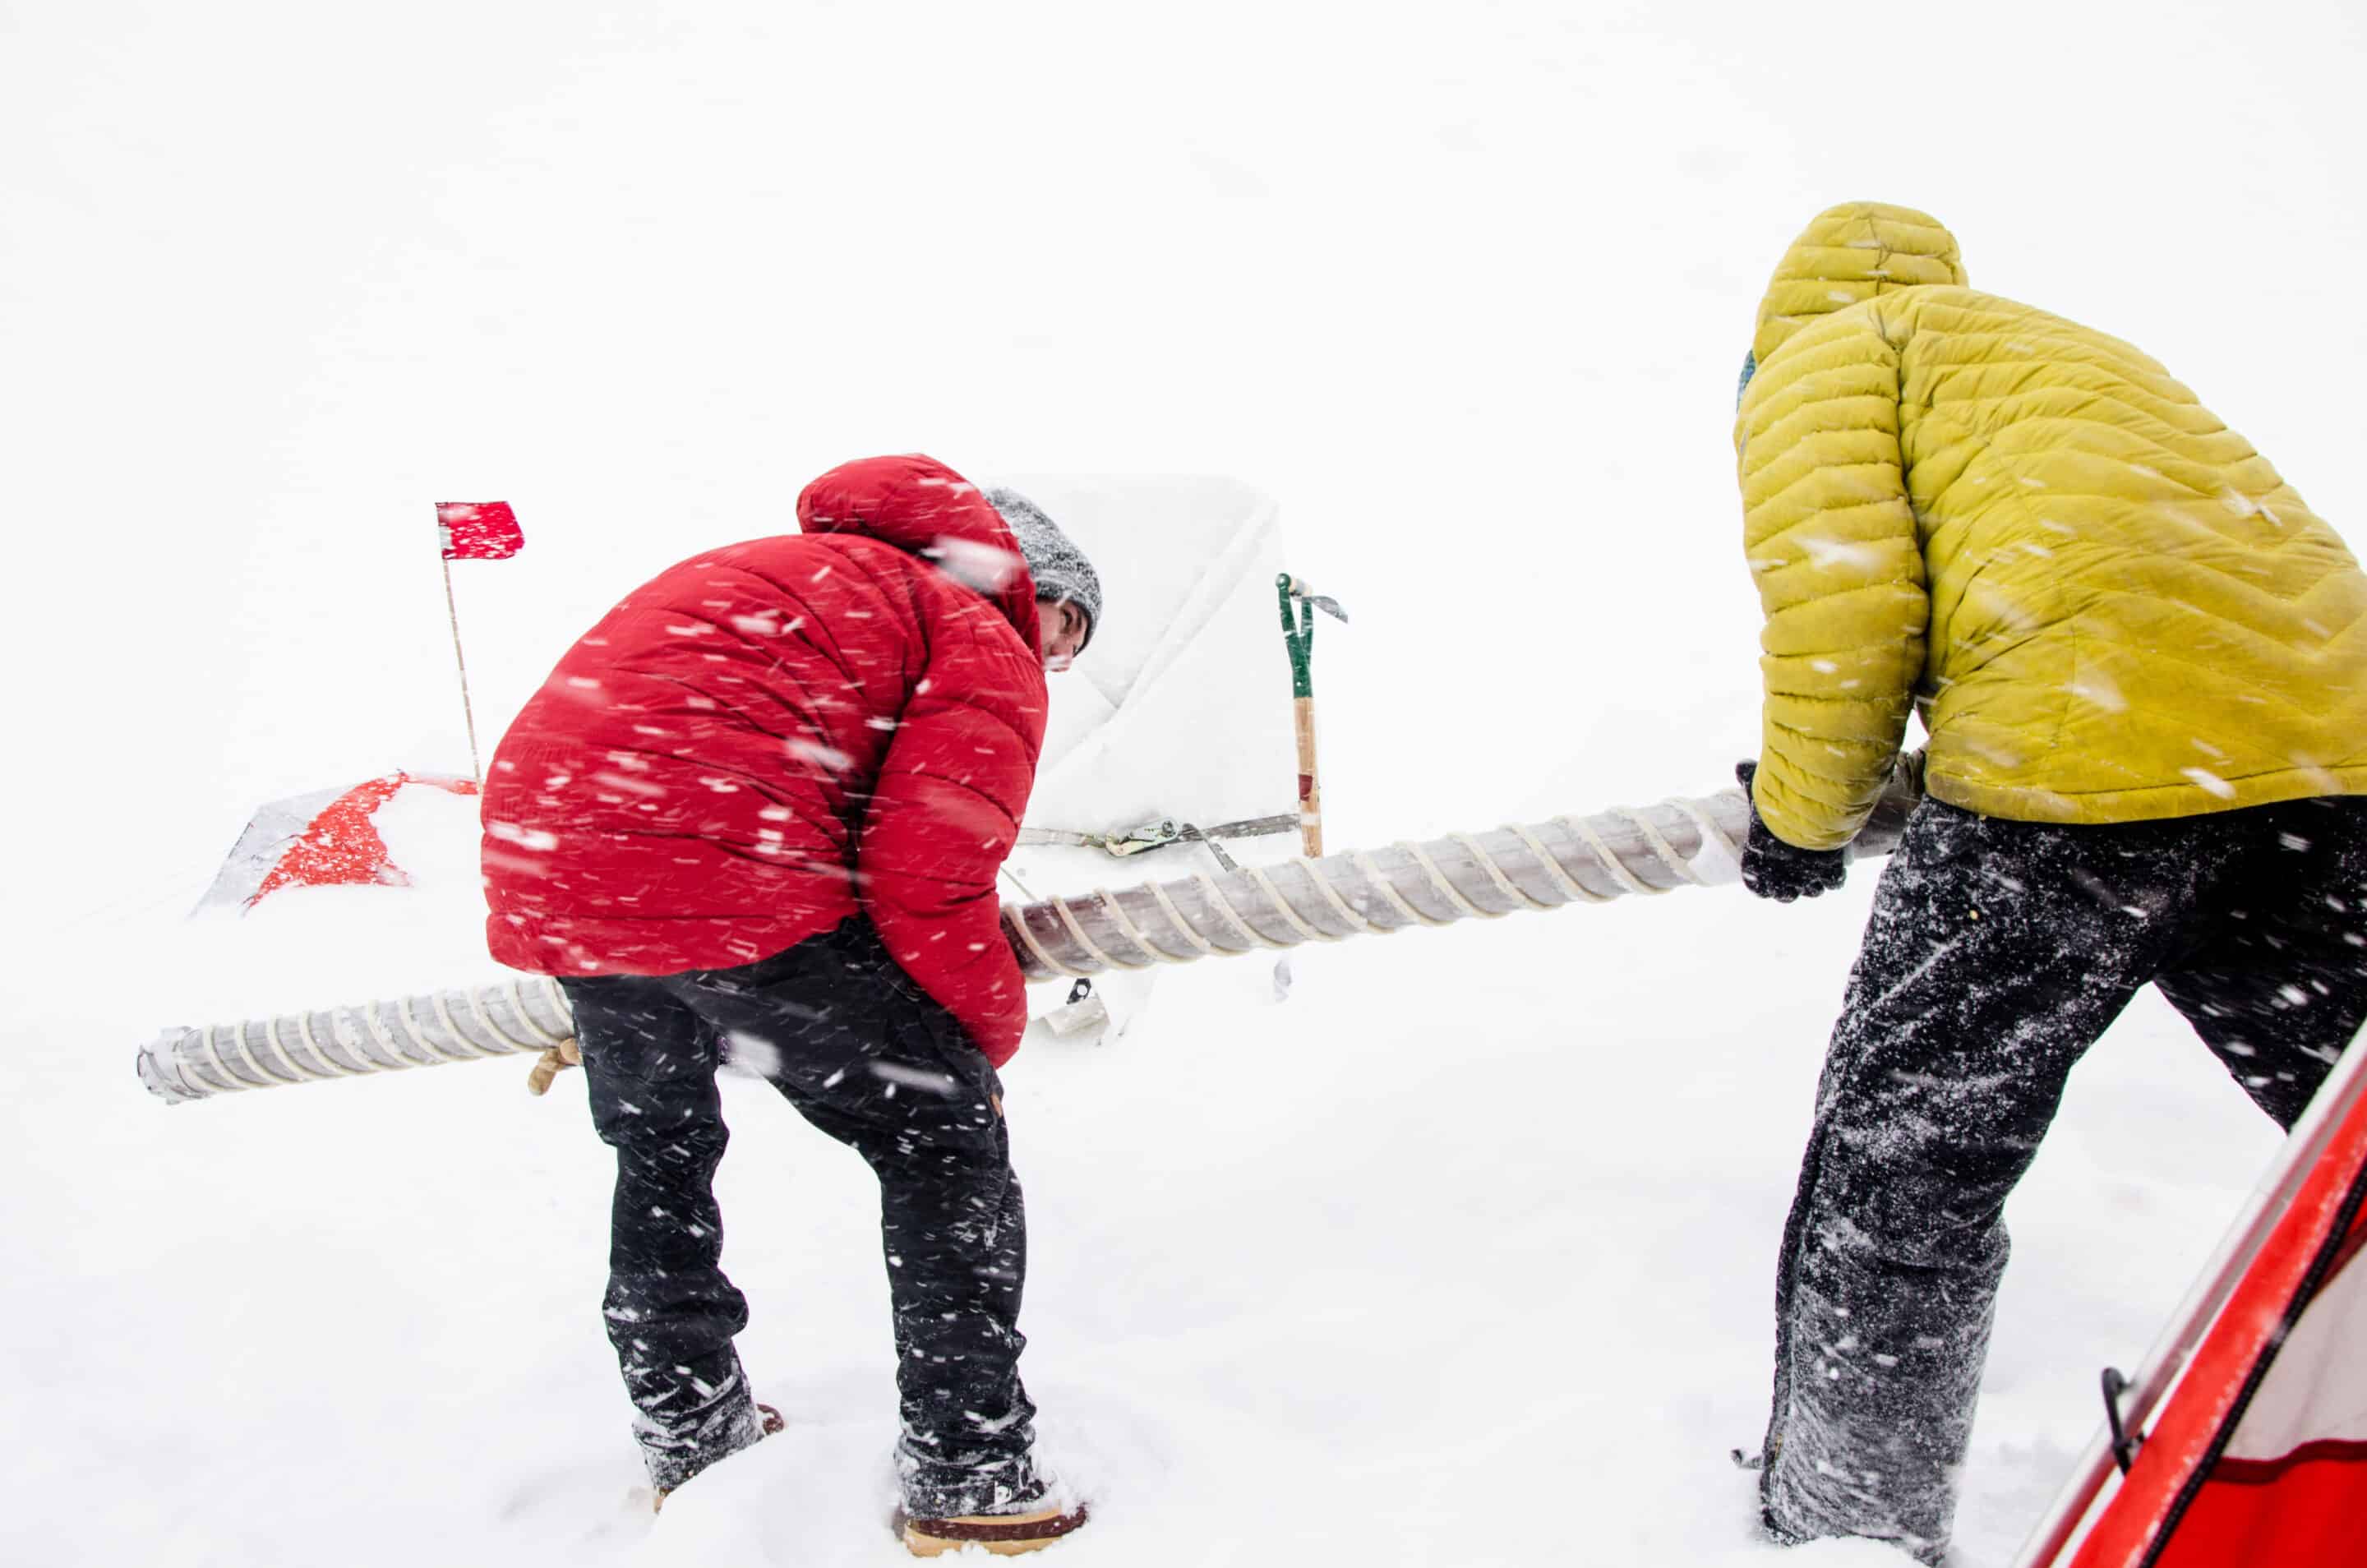
Recovering an ice core from west Greenland. Credit: Sarah Has/Woods Hole Oceanographic Institution
The study, titled “Nonlinear Rise in Greenland Runoff in Response to Post-industrial Arctic Warming”, was published in the journal Nature in on December 5, 2018: https://doi.org/10.1038/s41586-018-0752-4. A detailed press release from Woods Hole Oceanographic Institution is below.
Greenland Ice Sheet Melt ‘Off the Charts’ Compared with Past Four Centuries
Surface melting across Greenland’s mile-thick ice sheet began increasing in the mid-19th century and then ramped up dramatically during the 20th and early 21st centuries, showing no signs of abating, according to new research published Dec. 5, 2018, in the journal Nature. The study provides new evidence of the impacts of climate change on Arctic melting and global sea level rise.
“Melting of the Greenland Ice Sheet has gone into overdrive. As a result, Greenland melt is adding to sea level more than any time during the last three and a half centuries, if not thousands of years,” said Luke Trusel, a glaciologist at Rowan University’s School of Earth & Environment and former post-doctoral scholar at Woods Hole Oceanographic Institution, and lead author of the study. “And increasing melt began around the same time as we started altering the atmosphere in the mid-1800s.”
“From a historical perspective, today’s melt rates are off the charts, and this study provides the evidence to prove this,” said Sarah Das, a glaciologist at Woods Hole Oceanographic Institution (WHOI) and co-author of the study. “We found a fifty percent increase in total ice sheet meltwater runoff versus the start of the industrial era, and a thirty percent increase since the 20th century alone.”

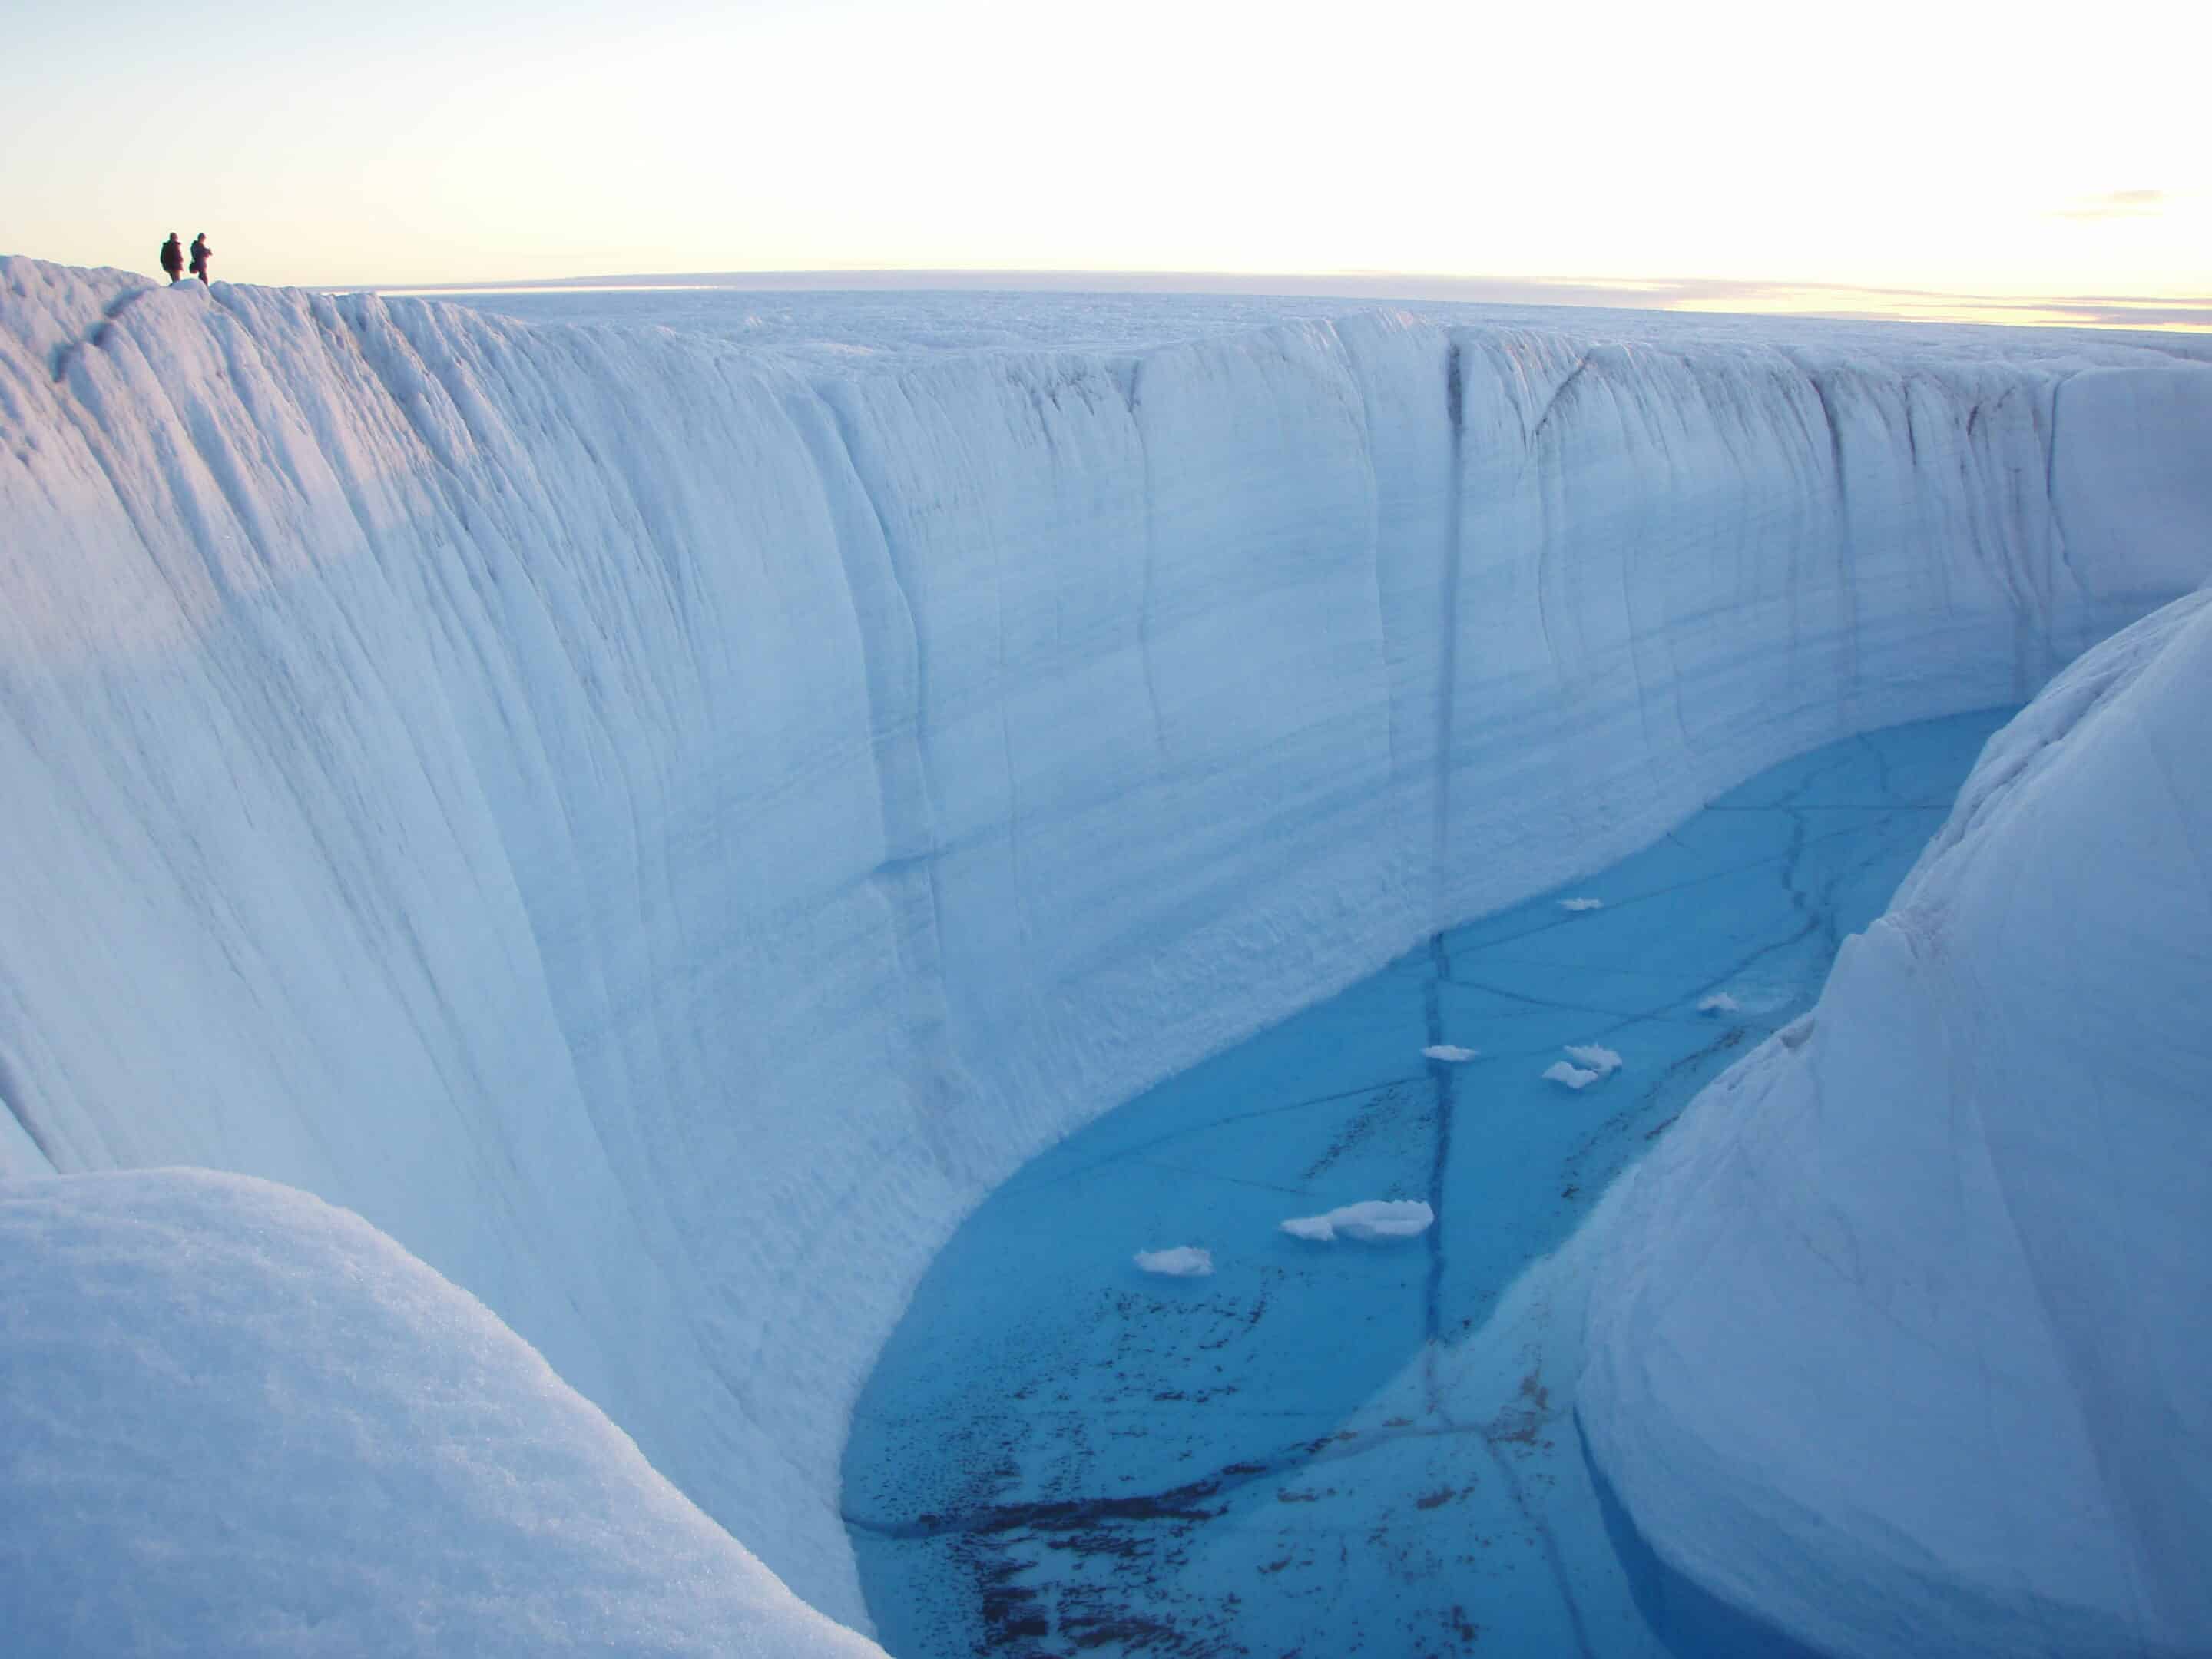
Meltwater lakes on the Greenland ice sheet. Credit: Sarah Das/Woods Hole Oceanographic Institution.
Ice loss from Greenland is one of the key drivers of global sea level rise. Icebergs calving into the ocean from the edge of glaciers represent one component of water re-entering the ocean and raising sea levels. But more than half of the ice-sheet water entering the ocean comes from runoff from melted snow and glacial ice atop the ice sheet. The study suggests that if Greenland ice sheet melting continues at “unprecedented rates”—which the researchers attribute to warmer summers—it could accelerate the already fast pace of sea level rise.
“Rather than increasing steadily as climate warms, Greenland will melt increasingly more and more for every degree of warming. The melting and sea level rise we’ve observed already will be dwarfed by what may be expected in the future as climate continues to warm,” said Trusel.
To determine how intensely Greenland ice has melted in past centuries, the research team used a drill the size of a traffic light pole to extract ice cores from the ice sheet itself and an adjacent coastal ice cap, at sites more than 6,000 feet above sea level. The scientists drilled at these elevations to ensure the cores would contain records of past melt intensity, allowing them to extend their records back into the 17th century.
During warm summer days in Greenland, melting occurs across much of the ice sheet surface. At lower elevations, where melting is the most intense, meltwater runs off the ice sheet and contributes to sea level rise, but no record of the melt remains. At higher elevations, however, the summer meltwater quickly refreezes from contact with the below-freezing snowpack sitting underneath. This prevents it from escaping the ice sheet in the form of runoff. Instead, it forms distinct icy bands that stack up in layers of densely packed ice over time.
The core samples were brought back to ice core labs at the U.S. National Science Foundation Ice Core Facility in Denver, Colo., WHOI in Woods Hole, Mass., Wheaton College in Norton, Mass., and the Desert Research Institute in Reno, Nev. where the scientists measured physical and chemical properties along the cores to determine the thickness and age of the melt layers. Dark bands running horizontally across the cores, like ticks on a ruler, enabled the scientists to visually chronicle the strength of melting at the surface from year to year. Thicker melt layers represented years of higher melting, while thinner sections indicated years with less melting.

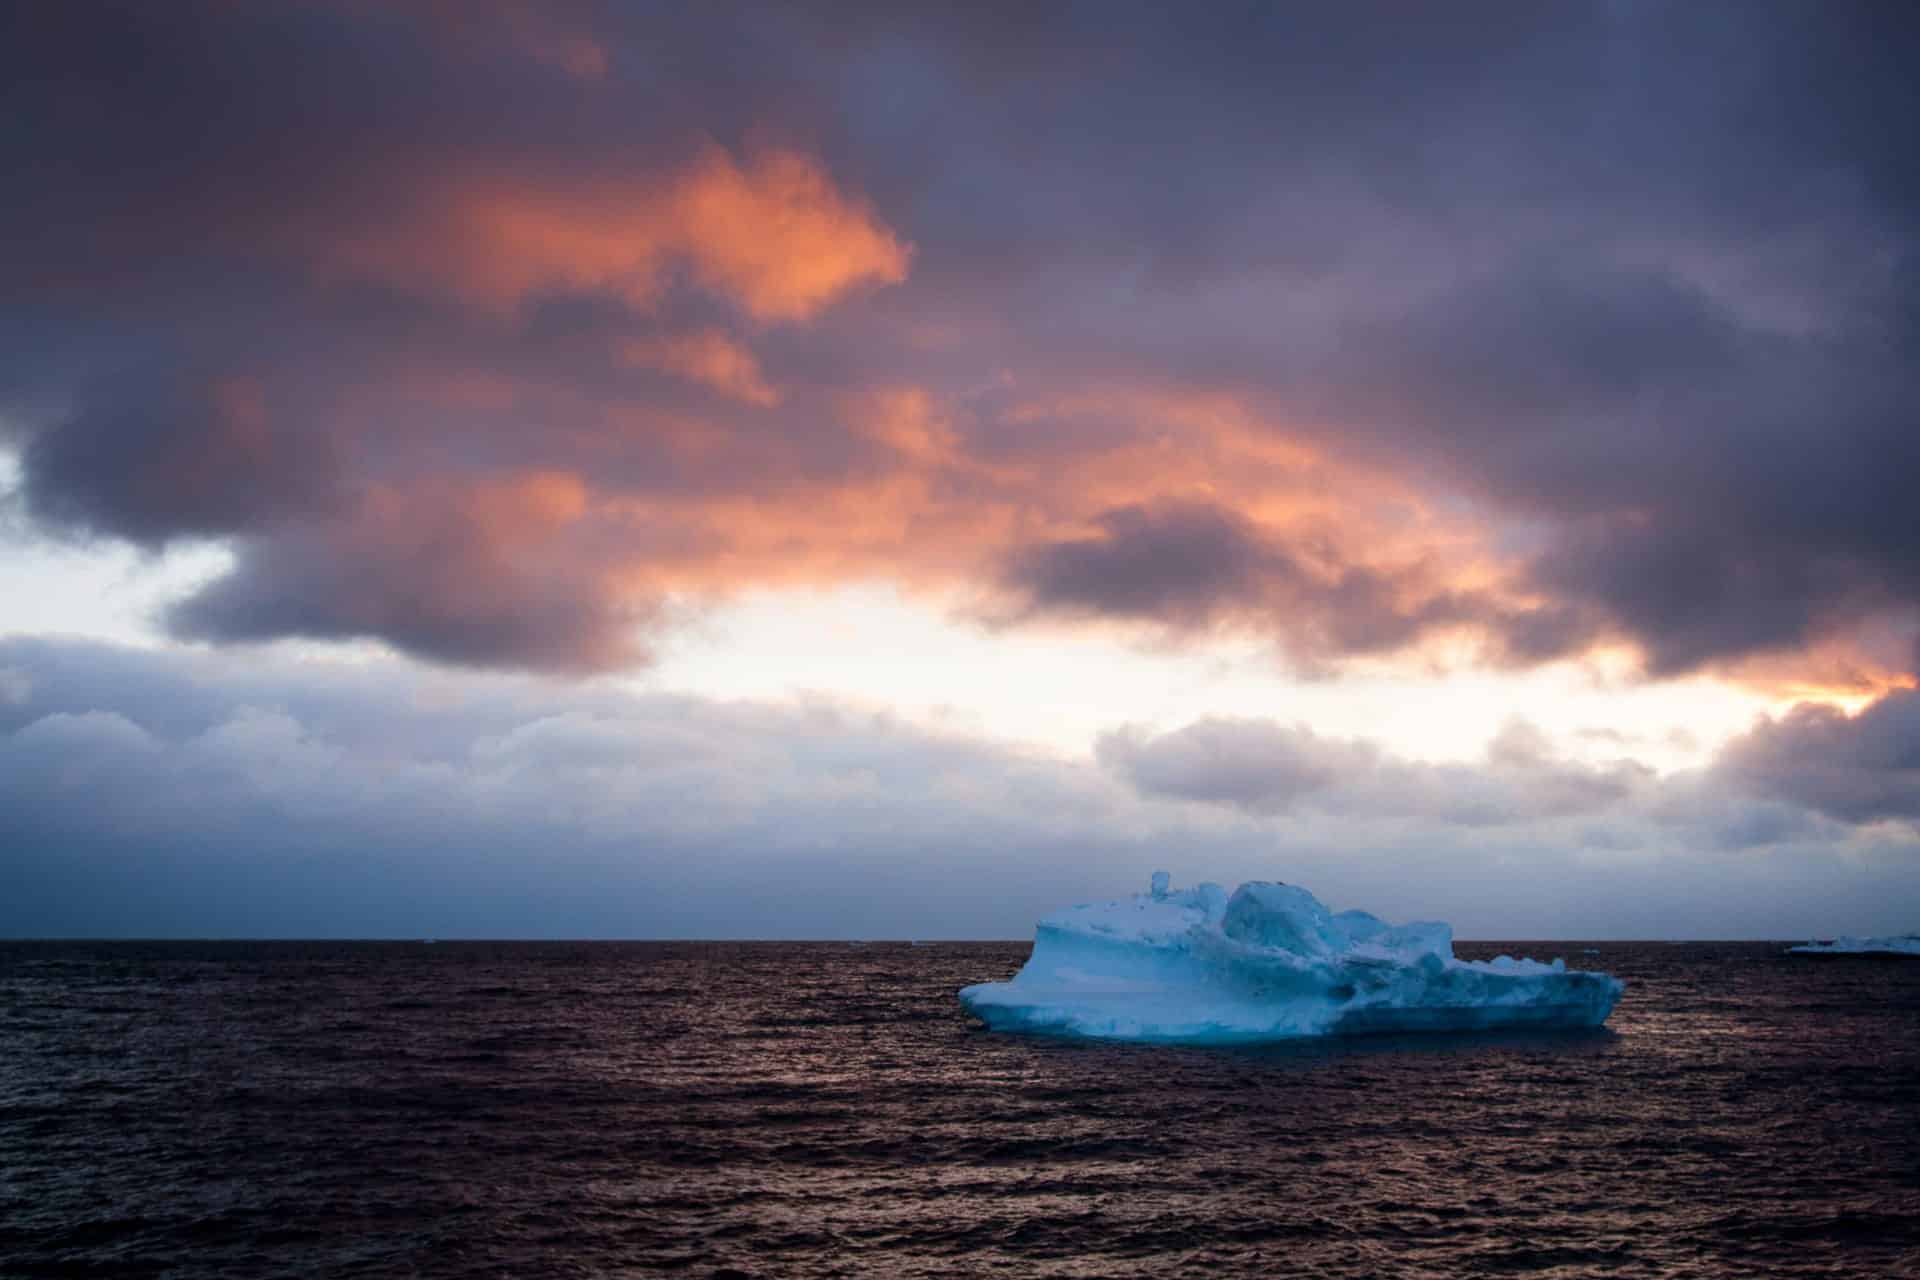
Iceberg in Disko Bay, west Greenland. Credit Luke Trusel/Rowan University.
Combining results from multiple ice cores with observations of melting from satellites and sophisticated climate models, the scientists were able to show that the thickness of the annual melt layers they observed clearly tracked not only how much melting was occurring at the coring sites, but also much more broadly across Greenland. This breakthrough allowed the team to reconstruct meltwater runoff at the lower-elevation edges of the ice sheet—the areas that contribute to sea level rise.
Ice core records provide critical historical context because satellite measurements—which scientists rely on today to understand melting rates in response to changing climate—have only been around since the late 1970s, said Matt Osman, a graduate student in the MIT-WHOI Joint Program and co-author of the study.
“We have had a sense that there’s been a great deal of melting in recent decades, but we previously had no basis for comparison with melt rates going further back in time,” he said. “By sampling ice, we were able to extend the satellite data by a factor of 10 and get a clearer picture of just how extremely unusual melting has been in recent decades compared to the past.”
Trusel said the new research provides evidence that the rapid melting observed in recent decades is highly unusual when put into a historical context.
“To be able to answer what might happen to Greenland next, we need to understand how Greenland has already responded to climate change,” he said. “What our ice cores show is that Greenland is now at a state where it’s much more sensitive to further increases in temperature than it was even 50 years ago.”
One noteworthy aspect of the findings, Das said, was how little additional warming it now takes to cause huge spikes in ice sheet melting.
“Even a very small change in temperature caused an exponential increase in melting in recent years,” she said. “So the ice sheet’s response to human-caused warming has been non-linear.” Trusel concluded, “Warming means more today than it did in the past.”
Additional co-authors are: Matthew B. Osman, MIT/WHOI Joint Program in Oceanography; Matthew J. Evans, Wheaton College; Ben E. Smith, University of Washington; Xavier Fettweis, University of Leige; Joseph R. McConnell, Desert Research Institute; and Brice P. Y. Noël and and Michiel R. van den Broeke Utrecht University.
This research was funded by the US National Science Foundation, institutional support from Rowan University and Woods Hole Oceanographic Institution, the US Department of Defense, the Netherlands Organization for Scientific Research, the Netherlands Earth System Science Center, and the Belgian National Fund for Scientific Research.
###
Link to paper (on and after Dec. 5, 2018): https://doi.org/10.1038/s41586-018-0752-4
News media contacts:
WHOI Media Office- 508-289-3340, media@whoi.edu
Sarah Das, Ph.D., Woods Hole Oceanographic Institution (508) 289-2464 (office), sdas@whoi.edu https://www2.whoi.edu/staff/sdas/
Stephen Levine, News Officer, University Relations, Rowan University(856) 256-5443 (office), (856) 889-0491 (cell), Levines@Rowan.edu
Luke Trusel, Ph.D., School of Earth & Environment, Rowan University (856) 256 5262 (office), (508) 981-3073 (cell), trusel@rowan.edu, https://cryospherelab.org
The Desert Research Institute (DRI) is a recognized world leader in basic and applied interdisciplinary research. Committed to scientific excellence and integrity, DRI faculty, students, and staff have developed scientific knowledge and innovative technologies in research projects around the globe. Since 1959, DRI’s research has advanced scientific knowledge, supported Nevada’s diversifying economy, provided science-based educational opportunities, and informed policy makers, business leaders, and community members. With campuses in Reno and Las Vegas, DRI serves as the non-profit research arm of the Nevada System of Higher Education.


