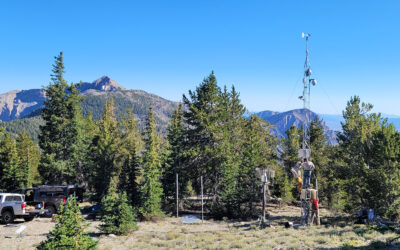
Researchers from DRI and UNLV teamed up with a Las Vegas community concerned about a neighboring asphalt plant to measure their air quality
Chen and his team published their findings April 10 in the journal Atmospheric Environment. The study used inexpensive air quality sensors placed strategically around Las Vegas’ Spring Valley High School to measure overall air quality and untangle how much, and when, the neighboring asphalt plant influenced particulate air pollution — namely PM2.5 and PM10. The researchers found that although the school’s air pollution never exceeded EPA limits, asphalt plant emissions contributed to PM2.5 and PM10 by as much as 28% and 50%, respectively, in a single day. Wind speed and direction had a large impact on how and when the plant’s emissions wafted toward the school. The researchers say the study can act as an example for one way that communities can address air quality and environmental justice concerns.
Below is a Q&A with Dr. Chen about the research, which has been lightly edited for clarity and length.
DRI: What inspired this study?
Chen: In 2017, I got a phone call from a community member living at the Lantern Garden apartment complex just east of this asphalt plant. He said a lot of community members were concerned about the dust and fumes generated by the plant, because they could see the dust buildup and accumulate in their yards. They wondered if there was any health effect from this facility. They had shared their concerns with the Clark County Air Quality Department, who said they didn’t need to be concerned because air quality standards weren’t being exceeded. However, the community wasn’t convinced because they could feel the dust every day.
Spring Valley High School is also right next to the asphalt plant, and it has 2,500 students. The school was also concerned because the plant got a major contract from the city around this time to supply the asphalt and other construction materials for a major highway expansion project in Las Vegas, so they were scaling up their operations.
From my point of view, the first thing we needed to do was to set up a monitoring program to evaluate the contribution of the facility to the local community as best we could. Of course, being in the desert, dust is always blowing in from all over, so we needed to design a way to measure this rigorously. This would help the community understand their local air quality better, as the closest monitoring station run by the Air Quality Department is 2 or 3 kilometers away.
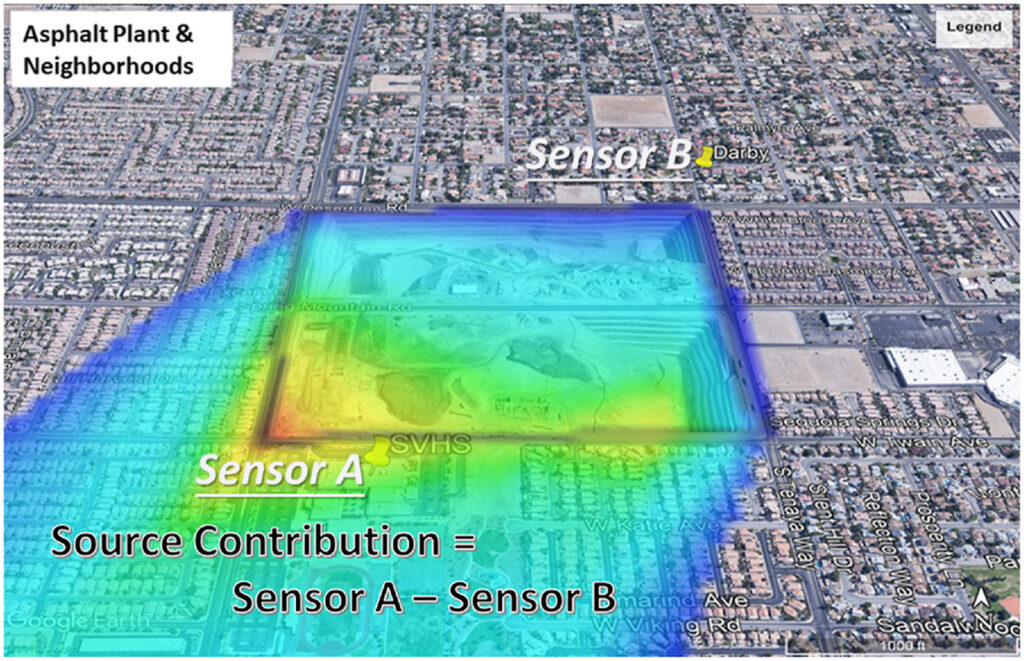
A satellite image showing the Wells Cargo asphalt plant in Las Vegas, with Spring Valley High School and neighboring communities impacted by the plant’s emissions when they are downwind. Credit: Roy et al., 2023
DRI: How did you design the air quality monitoring program to sift out emissions directly tied to the asphalt plant?
Chen: We did a pilot study for two weeks and then decided to work with the community to set up two sites, one downwind of the asphalt plant and one upwind of the plant. The upwind site was not really impacted by the facility, and the downwind site was. So, by looking at the difference between the two sites and the wind direction, we could determine the contributions from the asphalt plant. The two sites were less than 1 kilometer from each other, so their background levels of pollution were identical. We also conducted dispersion modeling to relate dust emissions with contributions under different wind speeds and directions.
We talked to the school, and they were happy to let us set up our monitoring station on their rooftop, and another community member helped us set up the other site. We had the air quality sensors in place from March through August 2019, so we could measure air quality over different seasons, wind speeds, and wind directions. We collected data every five minutes over this period, including the PM2.5 and PM10 concentrations.
Interestingly, right after we started our monitoring, the asphalt plant did a few things that seemed to improve their operation. They started covering up some of their piles, watering more to reduce dust emissions, and built a large wall around the facility. That could help prevent dust from being transported downwind.
I could say that even before we reported our results, we had already helped improve conditions for the community because the plant felt pressured to do something.
DRI: Why is it important to measure PM2.5 and PM10?
Chen: You can have different types of health outcomes from PM2.5 and PM10. PM2.5 is more likely to penetrate deeper into the respiratory tract, where it can cause lung diseases, whereas PM10 is more likely to stay in the upper airway.
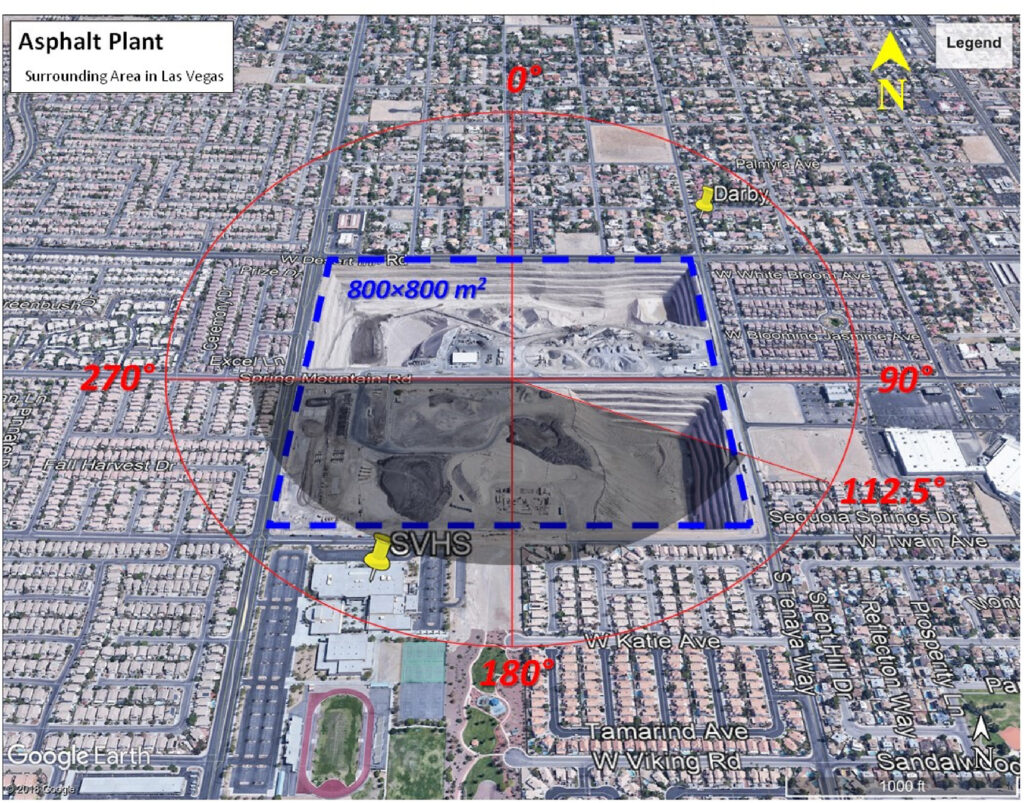
Satellite imagery of the Wells Cargo asphalt plant and surrounding area, with wind speed directions highlighted. Credit: Roy et al., 2023
DRI: Tell us about your results.
Chen: Well, the data we published was from 2019, which was before COVID-19 happened. This ended up changing a lot of things, and when I go back to the site now, I actually see that the conditions improved dramatically.
In our paper, we conclude that there is no exceedance to EPA air quality standards. But you can also see that there are significant contributions from the asphalt plant, 10 to 15% or so on average, depending on which metrics you look at. But in a single day, it can be up to 50%. That’s typically on a windy day, when the background air pollution is low, and then you can see a major contribution from the asphalt plant.
Even though air quality standards are met, the air quality standard is just one guideline. The World Health Organization (WHO) has a much lower guideline than the EPA, because even at very low levels, particulate matter can have health effects with longer exposure. So, we still have to try everything we can to reduce any contributions. Our study proves that the asphalt plant can do something to help with air quality.
Of course, it’s not just the facility that can reduce their emissions, as our data show that on average, 85% of the particulate air pollution is from other sources. Only a collective effort can further improve air quality conditions. We’ve come a long way in Las Vegas – air quality is much better than it was 20 or 30 years ago, that’s for sure. The Air Quality Department has done a good job, but that doesn’t mean there’s no room for improvement.
DRI: You also ran some computer simulations to better understand the data from the air quality sensors, right?
Chen: Yes, we needed to run a model to see whether some of the assumptions we made in our data analysis were valid or not. We wanted to understand, for example, if the difference between the upwind and downwind sites could really be attributed to the asphalt plant and how such differences are related to emissions. We used a computational fluid dynamics model to accomplish this, which helped validate our data to make the study more robust.
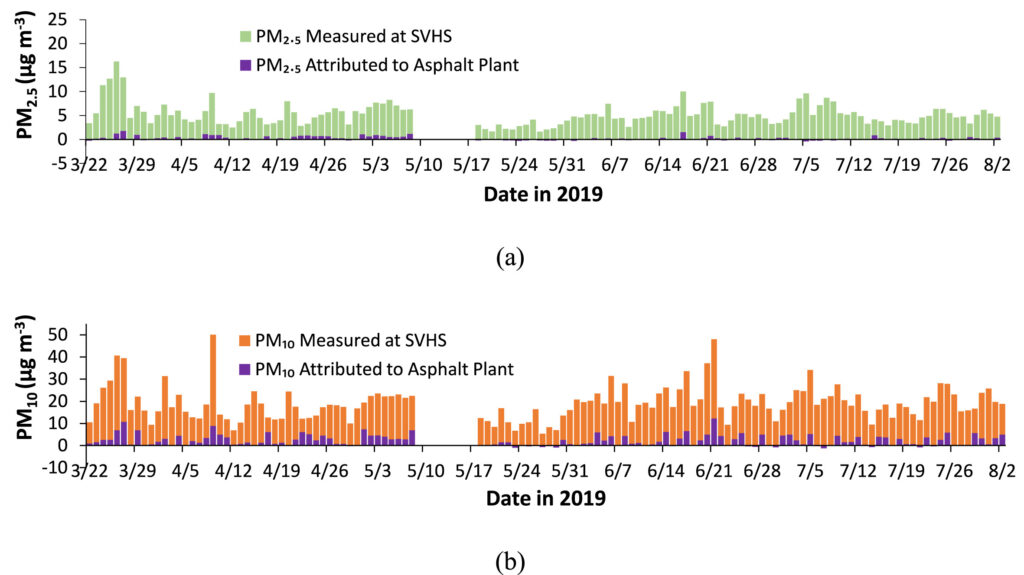
Above: Graph showing daily averages for (a) PM 2.5 and (b) PM 10-2.5 attributed to the asphalt plant. The highest proportions of asphalt plant PM 2.5 (28%) and PM 10 (50%) occurred on April 10, 2019 and April 22, 2019, respectively. Credit: Roy et al., 2023
DRI: How can this study help other communities who are concerned about their air quality?
Chen: I think the method we established can be used in similar situations because it’s relatively low cost, and with a quick turnaround time. Across the country, a lot of communities have concerns about industrial facilities nearby. Using this method, they can quantify whether there really is a significant contribution to their air quality from a specific source. It’s important to communicate risk in a transparent way and based on evidence – we can’t just tell them there’s nothing to worry about.
The low-cost air quality sensors we used weren’t available even ten years ago, at least not with the kind of precision and accuracy we have available now. This makes these types of studies more feasible. To have the best results, though, these sensors need to be calibrated correctly and regularly.
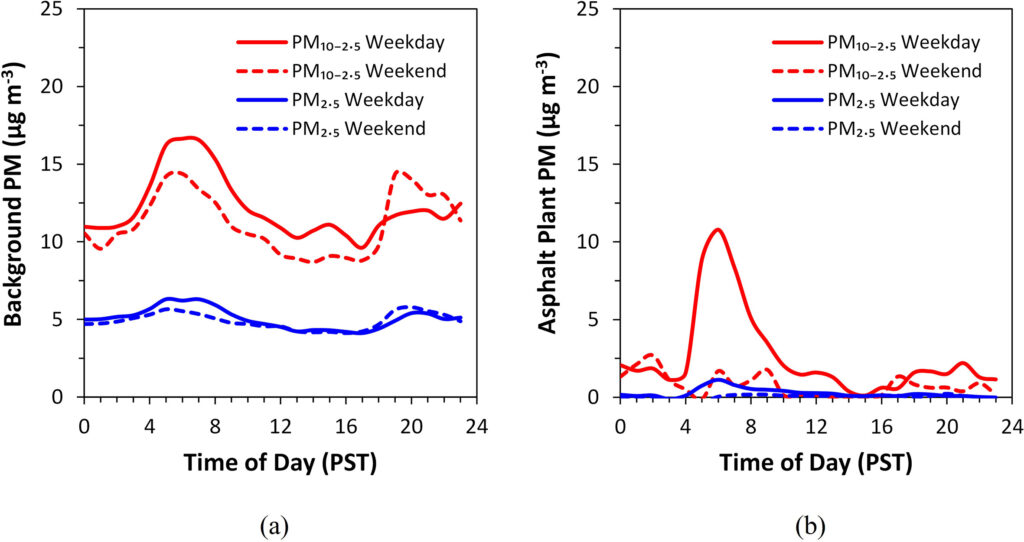
Hourly variations of PM2.5 and PM10-2.5 attributed to (a) urban background and (b) asphalt plant at SVHS on weekdays or weekends averaged throughout the monitoring period. Credit: Roy at al., 2023
DRI: How did the community respond to your findings?
Chen: The school was initially really worried about the situation, but when we presented them with our results, they said they are less concerned now. I think this is also because they could see that the asphalt plant was making improvements. They saw the wall being built, and they could see the plant changing some of their daily operations. We first presented our results to them in late 2019, and then of course the country entered pandemic mode and everyone’s concerns shifted.
DRI: Do you have any planned next steps for this line of research?
Chen: Well, it will be good to conduct a follow-up study as business resumes after the pandemic, if resources allow. Currently, there are very few low-cost sensors that are used by local communities in Las Vegas. People can actually set these up in their backyard, and report air quality and share the data. The more sensors we have in the community, the better understanding of the spatial distribution we’ll have of air quality conditions. In Salt Lake City, for example, their metro area and population are almost the same size as Las Vegas, and they have hundreds of these types of sensors across the city. But in Las Vegas, we have less than 30 now. Over the next few years, I will be trying to expand that network in some way and help community members calibrate their sensors in my lab and make sense of their data.
More Information
The full study, High time-resolution fenceline air quality sensing and dispersion modeling for environmental justice-centered source attribution, is available from Atmospheric Environment. https://doi.org/10.1016/j.atmosenv.2023.119778
Study authors include: Prosun Roy (Univ. of Nevada, Las Vegas), L.W. Antony Chen (Univ. of Nevada, Las Vegas/DRI), Aman Gebreselassie (Univ. of Nevada, Las Vegas), Yi Li (SailBri Cooper Inc.), Judith Chow (DRI), John Watson (DRI), and Yi-Tung Chen (Univ. of Nevada, Las Vegas)
