Making Sense of Remote Sensing
SEPT 28, 2020
RENO, NEV.
Remote Sensing
Evapotranspiration
Hydrologic Sciences
A Q&A with Matt Bromley on remote sensing and the OpenET project
Matt Bromley, M.S., is an Assistant Research Scientist with the Division of Hydrologic Sciences at the Desert Research Institute (DRI) in Reno, and specializes in GIS and remote sensing. He holds a B.S. in Environmental Science and a M.S. in Geography from the University of Nevada, Reno. He is a native Nevadan, an Army veteran, and has been a member of the DRI community for ten years.
Matt is currently working alongside a team of scientists and web developers from DRI, NASA, Google and Environmental Defense Fund (EDF) to develop a new web application called OpenET (https://openetdata.org/), which will make satellite-based data on evapotranspiration widely accessible to farmers, landowners, and water managers. We recently sat down with Matt to learn the basics of remote sensing and how it is used in the OpenET project.

Matt Bromley, M.S. is a an Assistant Research Scientist with the Division of Hydrologic Sciences at DRI in Reno.
DRI: You specialize in remote sensing. Can you tell us a little bit about this field of study?
Bromley: Technically, remote sensing means “the acquisition of data from a distance.” In the context of the work that I do, it means studying the earth’s surface with satellites. These satellites are often sensitive to same portions of the light-spectrum that our human eyes can see, as well as portions of the light spectrum that we can’t see, such as infrared (thermal). The images and data that Earth-focused satellites provide are a great way to learn about the Earth from a distance. There are also other types of remote sensing data, such as aerial images from planes, Radar, and LIDAR, where you use laser light to determine distance which can allow you to measure terrain and geographic features.
DRI: What is OpenET, and what is your role in the project?
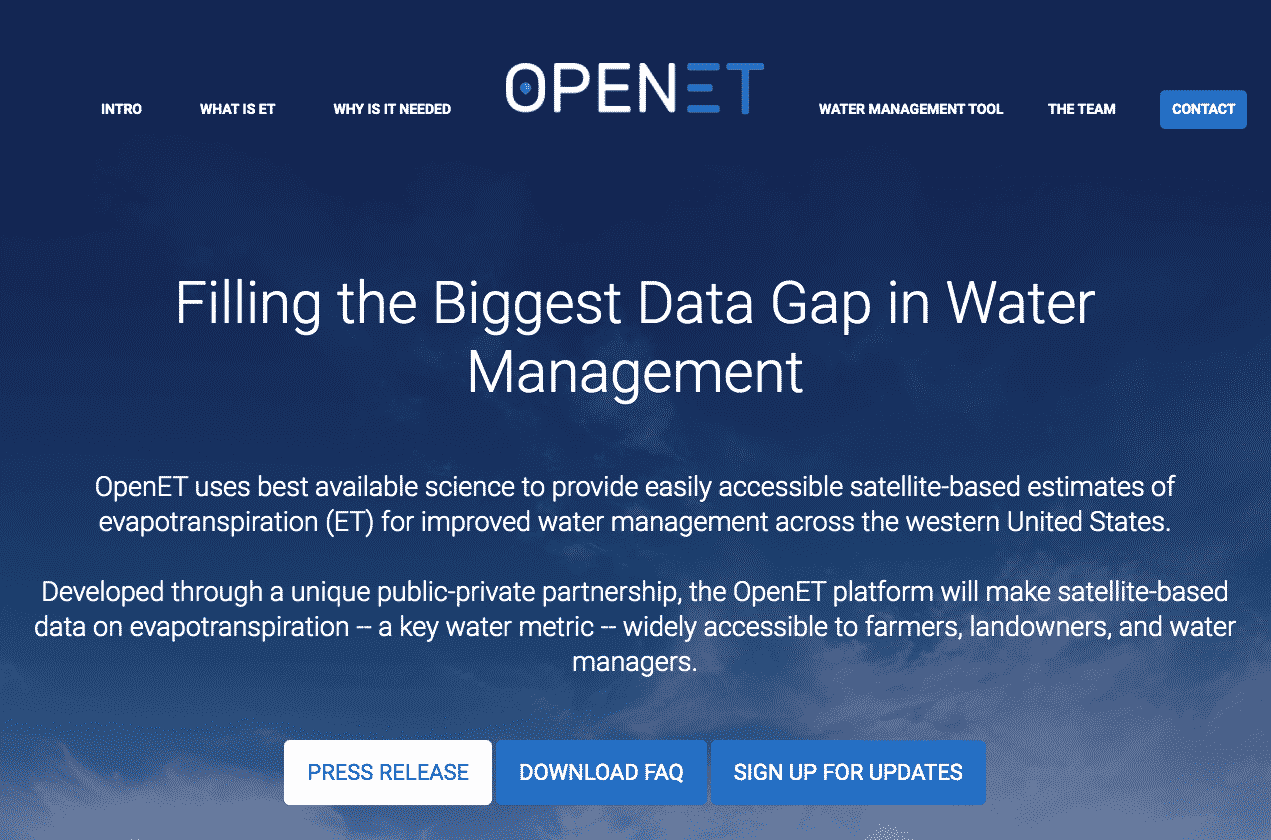
Bromley: To understand the importance of OpenET you have to first understand evapotranspiration (ET). ET is the process by which water is transferred from land to the atmosphere – through evaporation from soil and transpiration from plant leaves – which is approximately the amount of water used by crops to grow our food and other resources. OpenET is a new web application that will provide ET data to water managers, land owners, and farmers in 17 western states. We started building this tool in 2018 and it’s scheduled to launch in 2021.
My role is pretty varied within the project. I have a foot in the technical side of it, in that I’m working on some of the data used in the ET models as well as contributing to the analysis. I also have an outward facing role in that I engage with people and organizations who are the preliminary users of the data. I provide some analysis, answer questions, and act as the bridge between the teams developing the evapotranspiration data and the people using it.
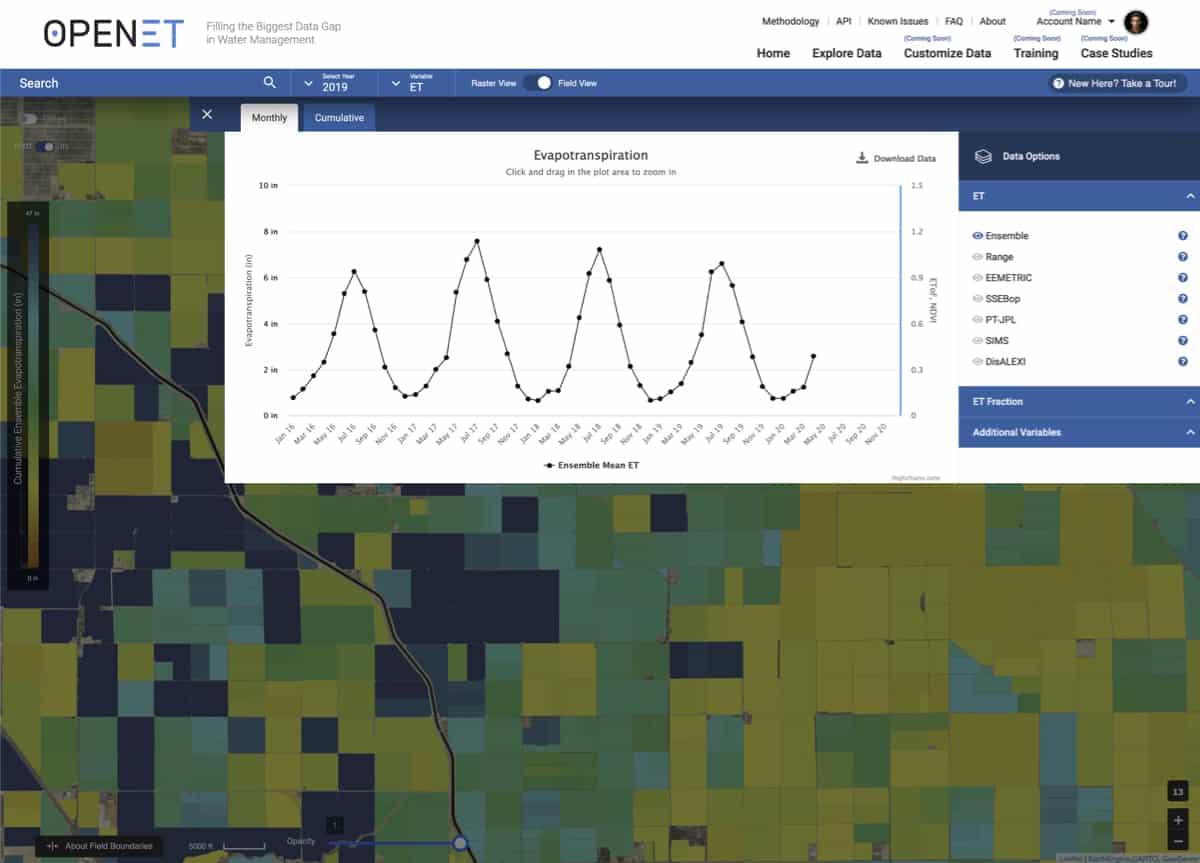
OpenET is a new web application that will provide evapotranspiration data to water managers, land owners and farmers across 17 western states.
Credit: OpenET.
To learn more about OpenET project, visit their website at openetdata.org.
DRI: How do you use remote sensing data in the OpenET project?
Bromley: The team that I work with uses remote sensing to measure water use from irrigation. We use both optical and thermal data to get information from the land surface. Among other things, the optical data shows how green and healthy the vegetation is, and with the thermal data we can actually detect the cooling effect that’s produced when water evaporates.
When I started at DRI, remote sensing data was generally processed on individual computers. You had to download all the data yourself and then process it with specialized software. About ten years ago, Google started hosting climate and remote sensing data in the cloud. So, rather than having to download all the data to do your analysis on a desktop computer, you can instead send your analysis to the cloud (lots of computers), allowing you to get some of your answers much, much faster. OpenET makes use of that platform, processing remote sensing data through five different models. Through OpenET we’re able to produce not only individual model ET estimates, but also an ensemble estimate using all of those models.
DRI: What type of remote sensing data do you use to calculate evapotranspiration (ET)?
Bromley: All of it right now is from the Landsat series of satellites, which gives us the optical and thermal data that we need to calculate ET. Landsat is a series of earth-observations satellites which are operated as a joint program between NASA and the USGS. The modern series of Landsat satellites started in the early 1980s, so with this collection of data we can actually look back in time and see how water use has changed over the decades. The duration and consistency of the Landsat program really sets it apart from other sources of remote sensing data.
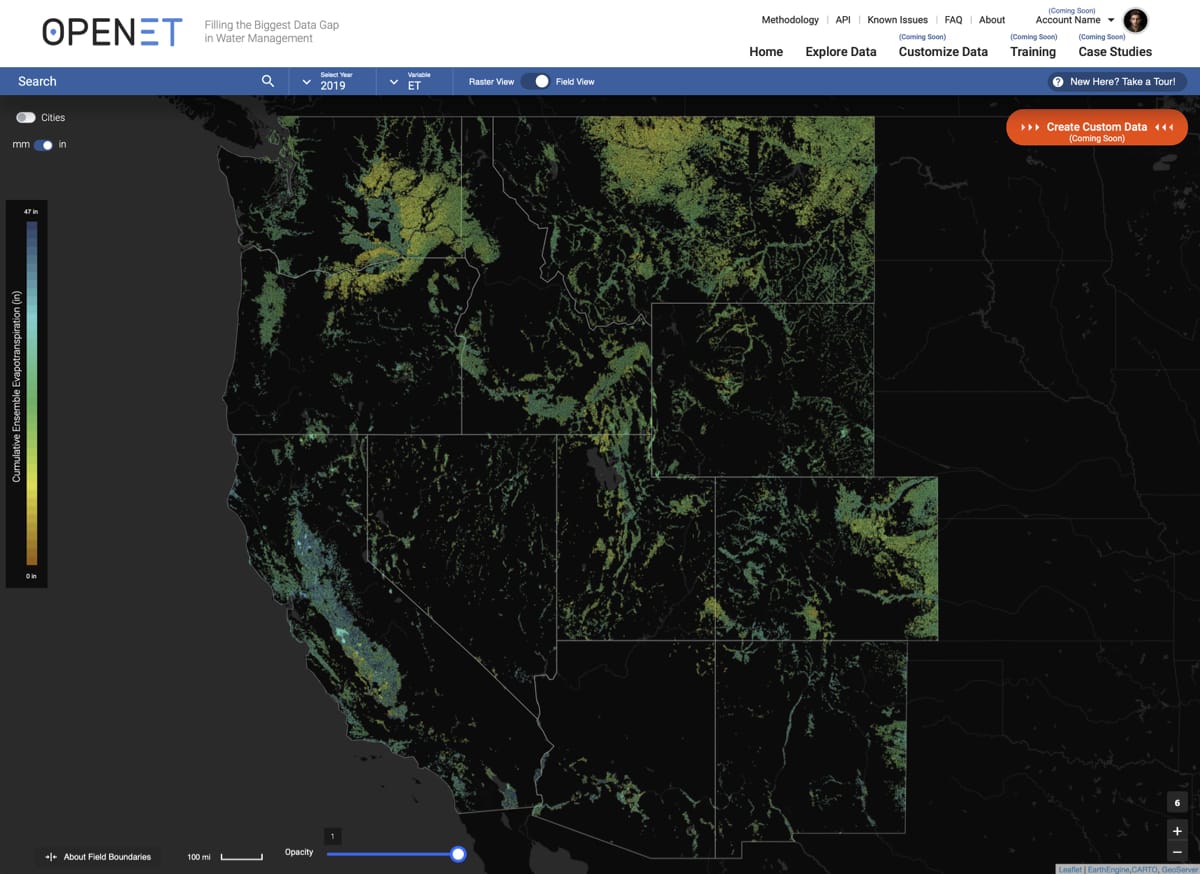
OpenET is being built by scientists and web developers from DRI, NASA, Google and Environmental Defense Fund (EDF). The web application is scheduled to launch in 2021.
Credit: OpenET.
DRI: How did you become interested in working in this field?
Bromley: Being a native Nevadan, you grow up being aware of how special water is. As a kid my family would go on road trips through the Great Basin and as much as I loved seeing the sagebrush and mountains, it felt like we were discovering an oasis whenever we’d drive past a river or lake. In working to understand water use, I’m providing information to the people who manage that precious resource, as well as to the farmers and ranchers who grow our food. It feels like I’m helping not just my community but the state and the region.
The work that we’re doing at DRI and with OpenET is especially important, because detailed information on water use at a large scale has typically been hard to access and very expensive. OpenET is working to change that and make this data widely accessible to spark improvements an innovation in water management across the West.
“In working to understand water use, I’m providing information to the people who manage that precious resource, as well as to the farmers and ranchers who grow our food.”
Additional information
Other DRI scientists that work on the OpenET project include Justin Huntington, Charles Morton, Britta Daudert and Jody Hansen.
To learn more about the OpenET project, please visit: https://openetdata.org/
To read a recent (September 2020) press release on the OpenET project, please visit: https://www.dri.edu/openet-2020-announcement/
To learn more about Matt Bromley and his research, please visit: https://www.dri.edu/directory/matthew-bromley/
