DRI scientists produced the most detailed projections yet for how the region’s landscape will be impacted by climate change
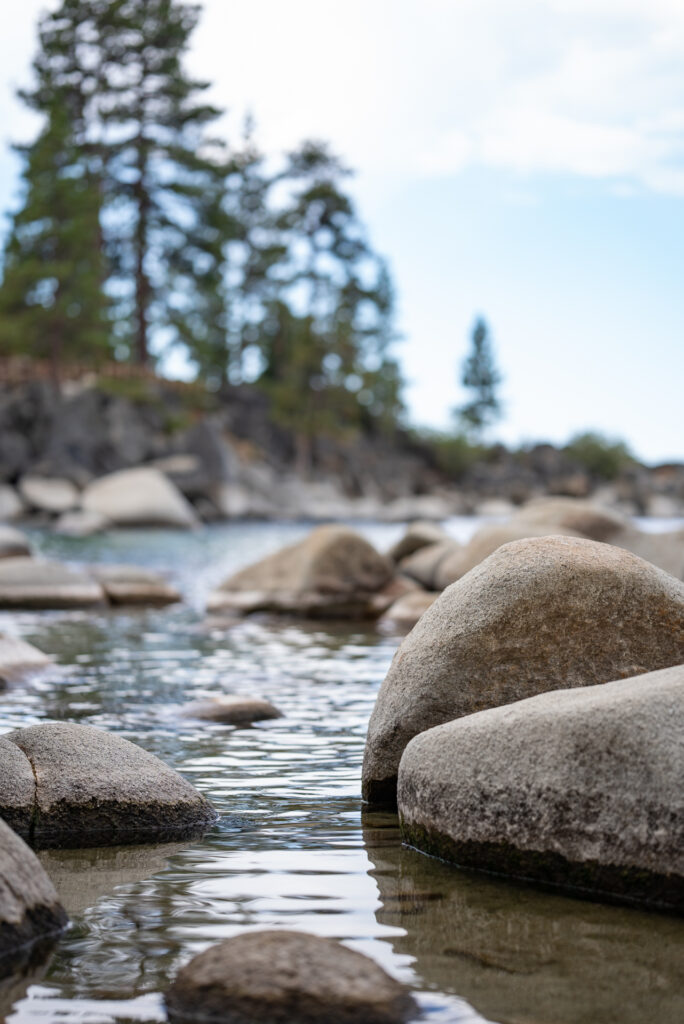
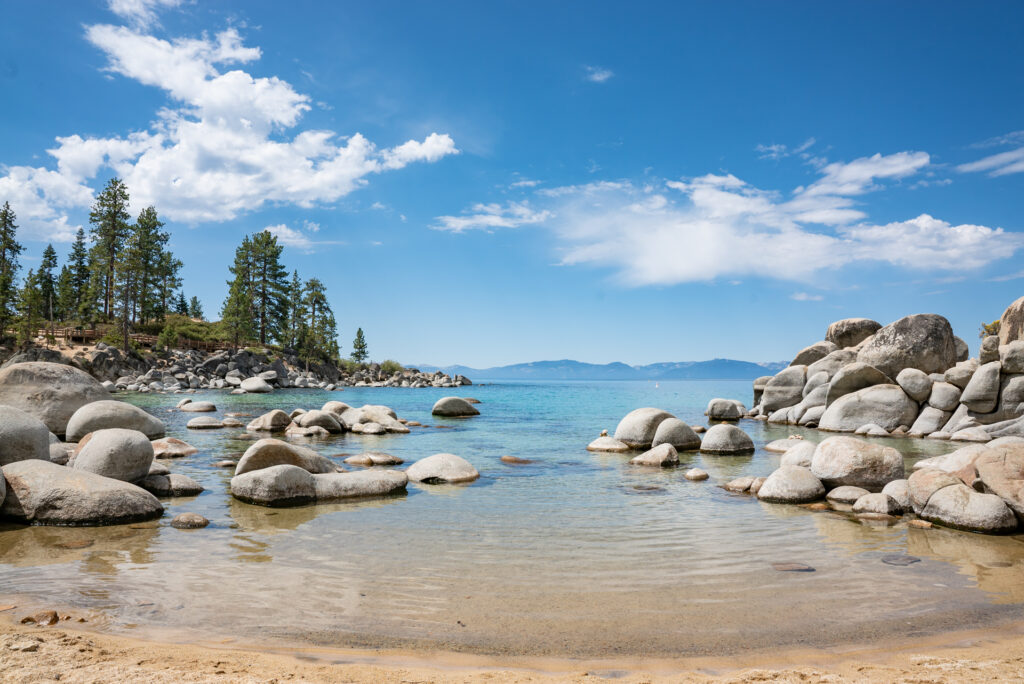
Lake Tahoe is known for its crystal-clear blue water, scenic mountain backdrop, and world-class recreation opportunities. Unfortunately, the lake and surrounding basin aren’t insulated from global climate change. Although the effects of rising atmospheric greenhouse gases can already be seen in the more frequent and intense wildfires, unpredictable snow seasons, and temperatures that creep ever higher, scientists and resource managers need the best possible projections for where, and how, the region will transform over time. This information can help communities to prepare by prioritizing restoration areas and infrastructure that can buffer the impacts.
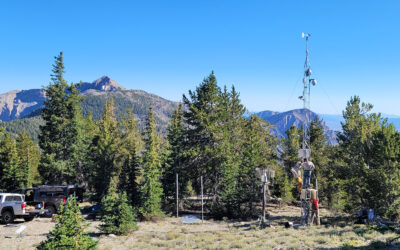
In an effort to understand these future challenges, the California Tahoe Conservancy requested help from DRI scientists Michael Dettinger, Ph.D., and Seshadri Rajagopal, Ph.D. For over a decade, DRI has been partnering with the USGS to develop a deep understanding of the hydrology of the Lake Tahoe Basin. Using over 50 years of detailed data about streamflow, snowmelt timing, and a range of other environmental variables, the result is a computer simulation that can examine ecosystem changes at a much higher resolution than previously possible — 1/29 of a square mile (about the size of tiny Alcatraz Island in the San Francisco Bay) vs the 14-square mile resolution previously used. With these tools, Dettinger and Rajagopal conducted a thorough analysis of all 60 subbasins that together comprise the Tahoe Basin.
“We don’t have a crystal ball,” Dettinger says. “But we can help communities determine whether they’re looking at stronger or weaker impacts so that they can make decisions about where to focus their resources.”
Making projections about the future still involves a lot of uncertainty, so they plugged climate-change projections from eight different global climate models into the hydrologic simulation of the Basin and examined two different futures: one where humanity reins in the use of greenhouse gases, and one where their use continues unabated.
The resulting report, Simulated Hydrologic Responses to Climate-Change Projections for the Lake Tahoe Basin, was completed earlier this year. It details anticipated changes for thirteen different environmental variables, including average temperatures, heat waves, snowmelt timing, total precipitation, and streamflow amounts and extremes. The report does not focus on impacts within the lake itself, but rather the surrounding land and watersheds; that’s because these areas are most responsible for inputs to the lake and are, Dettinger says, more actionable areas for people.
“Aside from protecting species within the lake and fighting invasives, pretty much the only place where people can do something to protect the lake is up in the watersheds where we live,” he says.
Although the report focused on producing precise projections for specific locations around the Basin, the global nature of climate change means that overall changes can be expected across the entire region. These include warming of 4 to 9 degrees Fahrenheit by the end of the century, and an increase in precipitation of up to 15%. Notably, climate whiplash will be more extreme, with wetter wet years amidst drier dry years. The increasing temperatures will result in warmer storms dropping more precipitation in large bursts, increasingly as rain rather than snow. This also means that floods are projected to increase – with flood risk nearly doubling in some subbasins without an effective curtailing of global greenhouse gas use. And the snow season, which is such an integral part of Lake Tahoe’s economy, will be one to three months shorter.
Overall, the north and east sides of the Lake Tahoe Basin are projected to experience higher impacts due to a combination of their topography and position on the drier side of the lake.
Dettinger, who also led the Sierra Nevada Regional Report of California’s Fourth Climate Change Assessment, has been conducting climate change projections since the mid-90s. He and Rajagopal met with stakeholder groups around the lake throughout the duration of the project to ensure that the report would produce the most useful information possible.
“It was about communicating to the community,” Dettinger says, “but it was arguably more about just getting the information in place, so instead of saying ‘well, the floods are going to get bigger,’ we could say ‘in this part of the Basin, the best projections we have are that a future 20-year flood is going to be twice as big as it has been historically.’ That way, when people want to design a culvert or restoration project, or something that can handle a 20-year flood, they know to think about building that much margin of error into the effort.”
Zooming in to the subbasin scale gives the most pinpointed results: by the end of the century (under a high-emissions future and judged from a combination of the most pressing climate effects), Trout Creek in the southeast corner of the Basin and Mill Creek near Incline Village are expected to experience the largest impacts. Eagle and Cascade Creeks near Emerald Bay are projected to be the least impacted overall. By comparing the greatest expected impacts, or “climate hot spots,” with the relatively weaker impacts expected at “climate refugia,” communities can decide how best to focus their resources, Dettinger says. Whether this means directing more effort toward protecting the most or least impacted places will be the hard decision moving forward.
There is one notable climate impact that the report does not address – wildfires. That’s because although scientists know that a warming atmosphere leads to higher fire risk, it’s impossible to predict where and when wildfires will occur. Therefore, although wildfire is an increasingly frequent part of life in the Lake Tahoe region, the report details how the impacts of climate change will impact the existing landscape. The extent to which extreme wildfires will continue to alter the forests (and thus the hydrology of the Basin) is another unknown factor that can potentially reshape the region.
Although the report itself is readily available online, Dettinger’s quest now is to find a permanent home for the data where researchers and resource agencies can easily locate it and apply it to their questions. (Update: Sep. 2023: The data are now permanently publicly available online thru DataDryad for anyone to download and use for climate-change science and planning activities: https://datadryad.org/stash/dataset/doi:10.5061/dryad.2v6wwpzrg) He hopes to work with web engineers to create a web app that can integrate the data with GIS mapping and provide the climate projections in intuitive and useful ways.
“We’ve got to figure out how to do this in a way that will actually benefit Tahoe,” he says, “because I believe that Tahoe is one of the few places that’s ready to do something to address the impacts of climate change – they just aren’t really sure what.”
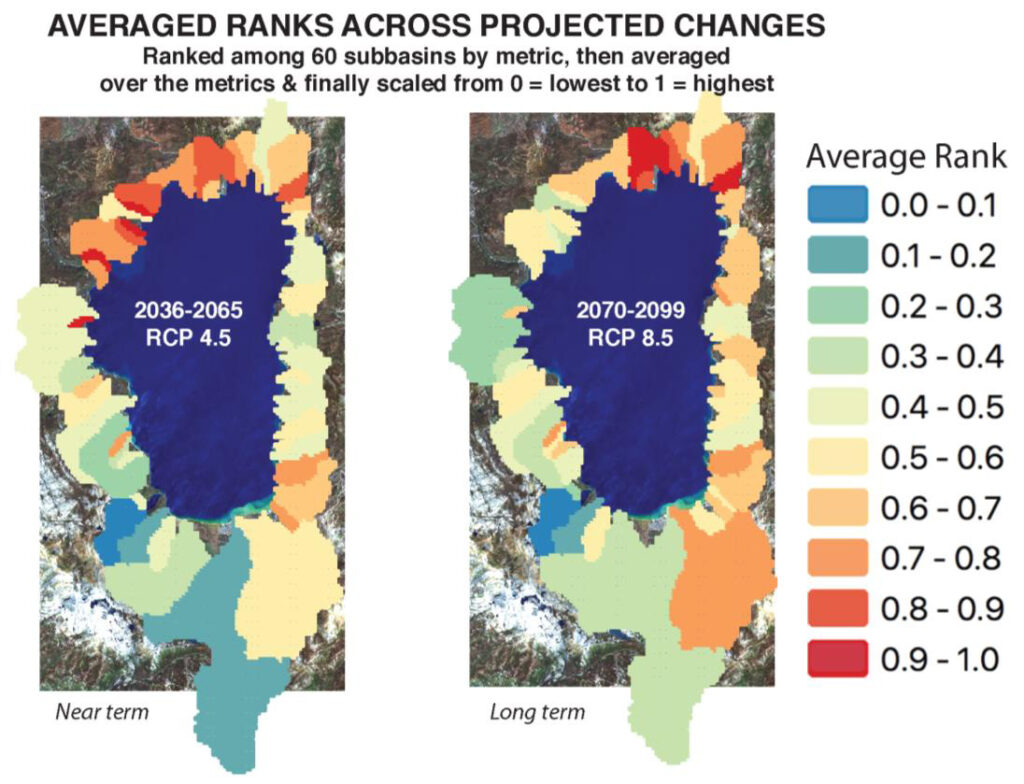
Figure 7.1 from the report showing the highest overall impacts in red and orange around the north and eastern sides of the Basin.
Full figure caption: Overall average of subbasin ranks of projected climate-change impacts in the Tahoe basin by (left) middle of 21st Century under RCP4.5 emissions, and by (right) end of 21st Century under RCP8.5 emissions. Measures included in this calculation are the projected changes of (1) annual precipitation, (2) maximum 3-day precipitation totals, (3) April 1 SWE, (4) snow-season length, (5) snowmelt timing, (6) annual snowmelt, (7) annual streamflow, (8) streamflow timing, (9) maximum 3-day streamflow totals, and (10) amount of rainfall on snow. Measure-by-measure, the subbasin responses are ranked from smallest to largest, and then all the ranks for each subbasin are averaged to arrive at a single average ranking for that subbasin. Then those average ranks are rescaled from 0 (subbasin with lowest average rank) to 1 (subbasin with highest average rank).
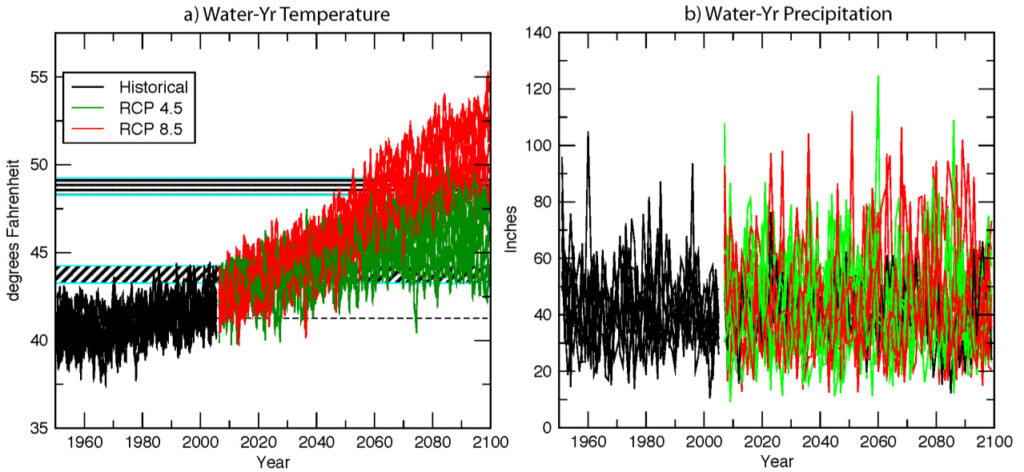
Figure E.1. from the report showing the projections for increases in air temperature and precipitation under two alternative futures: controlled emissions (RCP 4.5) and business-as-usual (RCP 8.5).
Full figure caption: Ensemble of projected changes in (a) air temperatures and (b) precipitation totals over the Upper Truckee River subbasin as an example of the changes projected by eight climate models (downscaled and run through the basin PRMS model). RCP 4.5 greenhouse-gas emissions are less than RCP 8.5 emissions, especially after mid-21st century. Hachured horizontal bars in (a) indicate warming of 2-3 degrees Fahrenheit and 7-8F warmer than the 1971-2000 historical norm (dashed line).
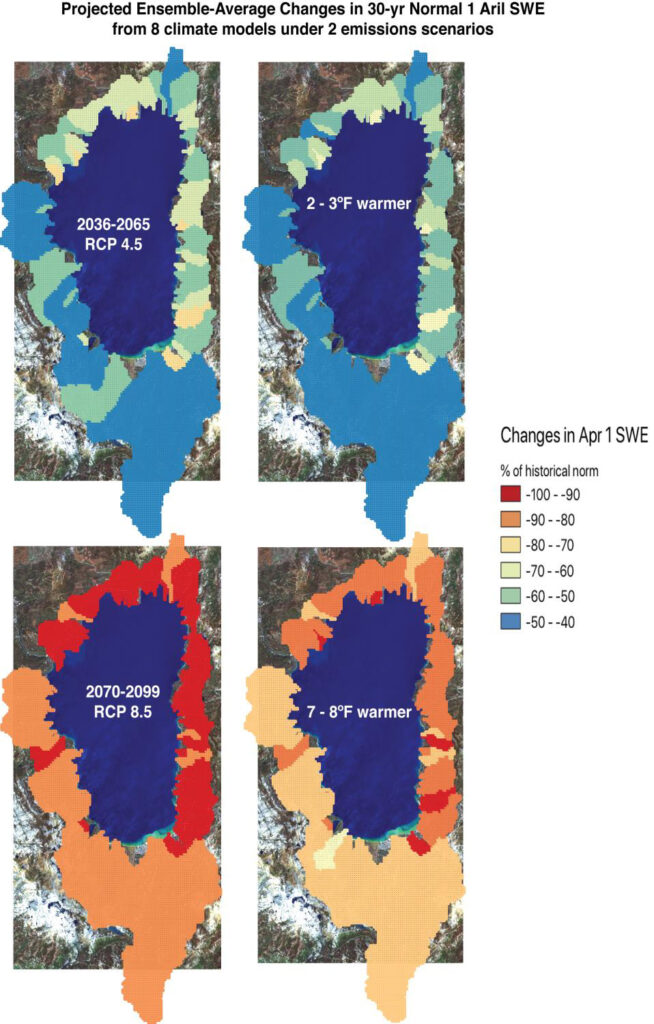
Figure E.2 from the report showing a decline in the snow-water-equivalent (SWE, or amount of water held in the snowpack) of about 50% by mid-century and 90-100% by 2100.
Full figure caption: Ensemble-average declines in 30-yr normal April 1 snow-water equivalents (SWE) over the Tahoe basin, as projected by eight climate models downscaled and run through the basin PRMS model (left) and for nonoverlapping 30-yr segments from the overall ensemble with average warming in the hachured ranges in Figure E-1a (right). Percentage of normal is reported such that “+90%” means the future value is 1.9 times the historical norm.
More information:
DRI scientists also serve on the Tahoe Science Advisory Council and consistently complete research focused on ecosystem and public health regionwide.