Reno, NV (Sept 10, 2018) – Scientists from the Western Regional Climate Center (WRCC) at the Desert Research Institute (DRI) in Reno, NV are pleased to announce the release of a long-awaited update to a climate mapping tool called the California Climate Tracker (https://wrcc.dri.edu/Climate/Tracker/CA/).
Originally launched in 2009, the California Climate Tracker was designed to support climate monitoring in California and allows users to generate maps and graphs of temperature and precipitation by region. The 2018 upgrade incorporates substantial improvements including a more user-friendly web interface, improved accuracy of information based on PRISM data, and access to climate maps and data that go back more than 120 years, to 1895.

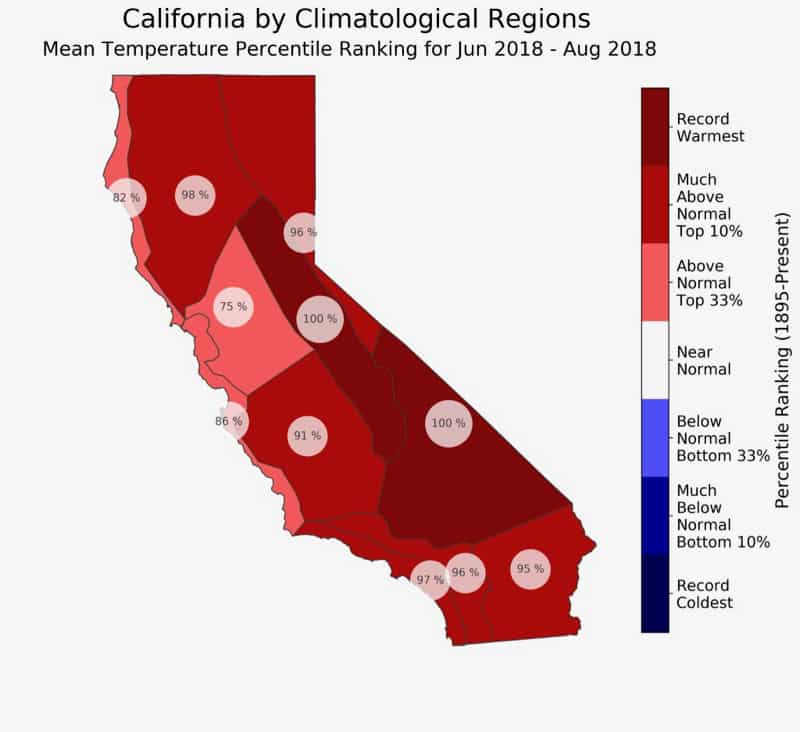
The map above, created using California Climate Tracker, shows mean temperature percentile rankings for different climatological regions in California during June – August 2018. Credit: Dan McEvoy, DRI.
“One really significant change between the old and new versions of the California Climate Tracker is that in the previous version, you weren’t able to look at archived maps,” said Daniel McEvoy, Ph.D., Assistant Research Professor of Climatology at DRI and member of the Climate Tracker project team. “Now you can say for example, ‘I want to see what the 1934 drought looked like,’ and go back and get the actual maps and data from 1934. You can also look at graphs of the data and see trends in temperature and precipitation over time.”
In addition to providing historical and modern data for regions across California, this easy-to-use web-based tool can be used to produce publication-quality graphics for reports, articles, presentations or other needs. It can be accessed for free by anyone with a standard web browser and an internet connection.
“The California Climate Tracker was initially designed and developed for use by the California Department of Water Resources, but we hope it is also useful to a much broader community of water managers, climatologists, meteorologists and researchers in California,” McEvoy said.

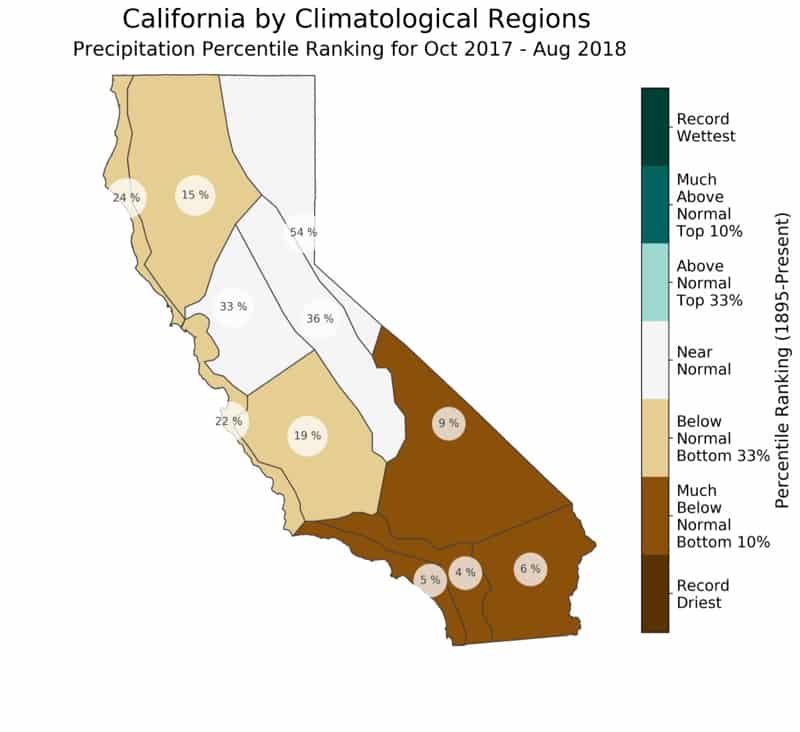
The map above, created using California Climate Tracker, shows precipitation percentile rankings for various climatological regions in California during October 2017 – August 2018. Credit: Dan McEvoy, DRI
The recent upgrade to this tool was the work of Nina Oakley, Ph.D., Justin Chambers, and McEvoy, all of whom are part of the Western Regional Climate Center at DRI. The original version of the California Climate Tracker tool was developed at DRI and designed by John Abatzoglou, Ph.D., now of the University of Idaho, based on a system for identifying regional patterns of climate variability within the state of California that he developed with Laura Edwards, M.S, now State Climatologist and Climate Field Specialist for the South Dakota State Climate Office, and the late Kelly Redmond, Ph.D., former regional climatologist for WRCC and DRI.
The California Climate Tracker was built with support from and in collaboration with the California Department of Water Resources. The team is currently in the process of building a similar tool for Nevada and are seeking funding partners to sponsor that work.
To access the California Climate Tracker tool, please visit: https://wrcc.dri.edu/Climate/Tracker/CA/
For more information on the Western Regional Climate Center at DRI, please visit: https://wrcc.dri.edu
###
The Desert Research Institute (DRI) is a recognized world leader in basic and applied interdisciplinary research. Committed to scientific excellence and integrity, DRI faculty, students, and staff have developed scientific knowledge and innovative technologies in research projects around the globe. Since 1959, DRI’s research has advanced scientific knowledge, supported Nevada’s diversifying economy, provided science-based educational opportunities, and informed policy makers, business leaders, and community members. With campuses in Reno and Las Vegas, DRI serves as the non-profit research arm of the Nevada System of Higher Education. For more information, please visit www.dri.edu.


